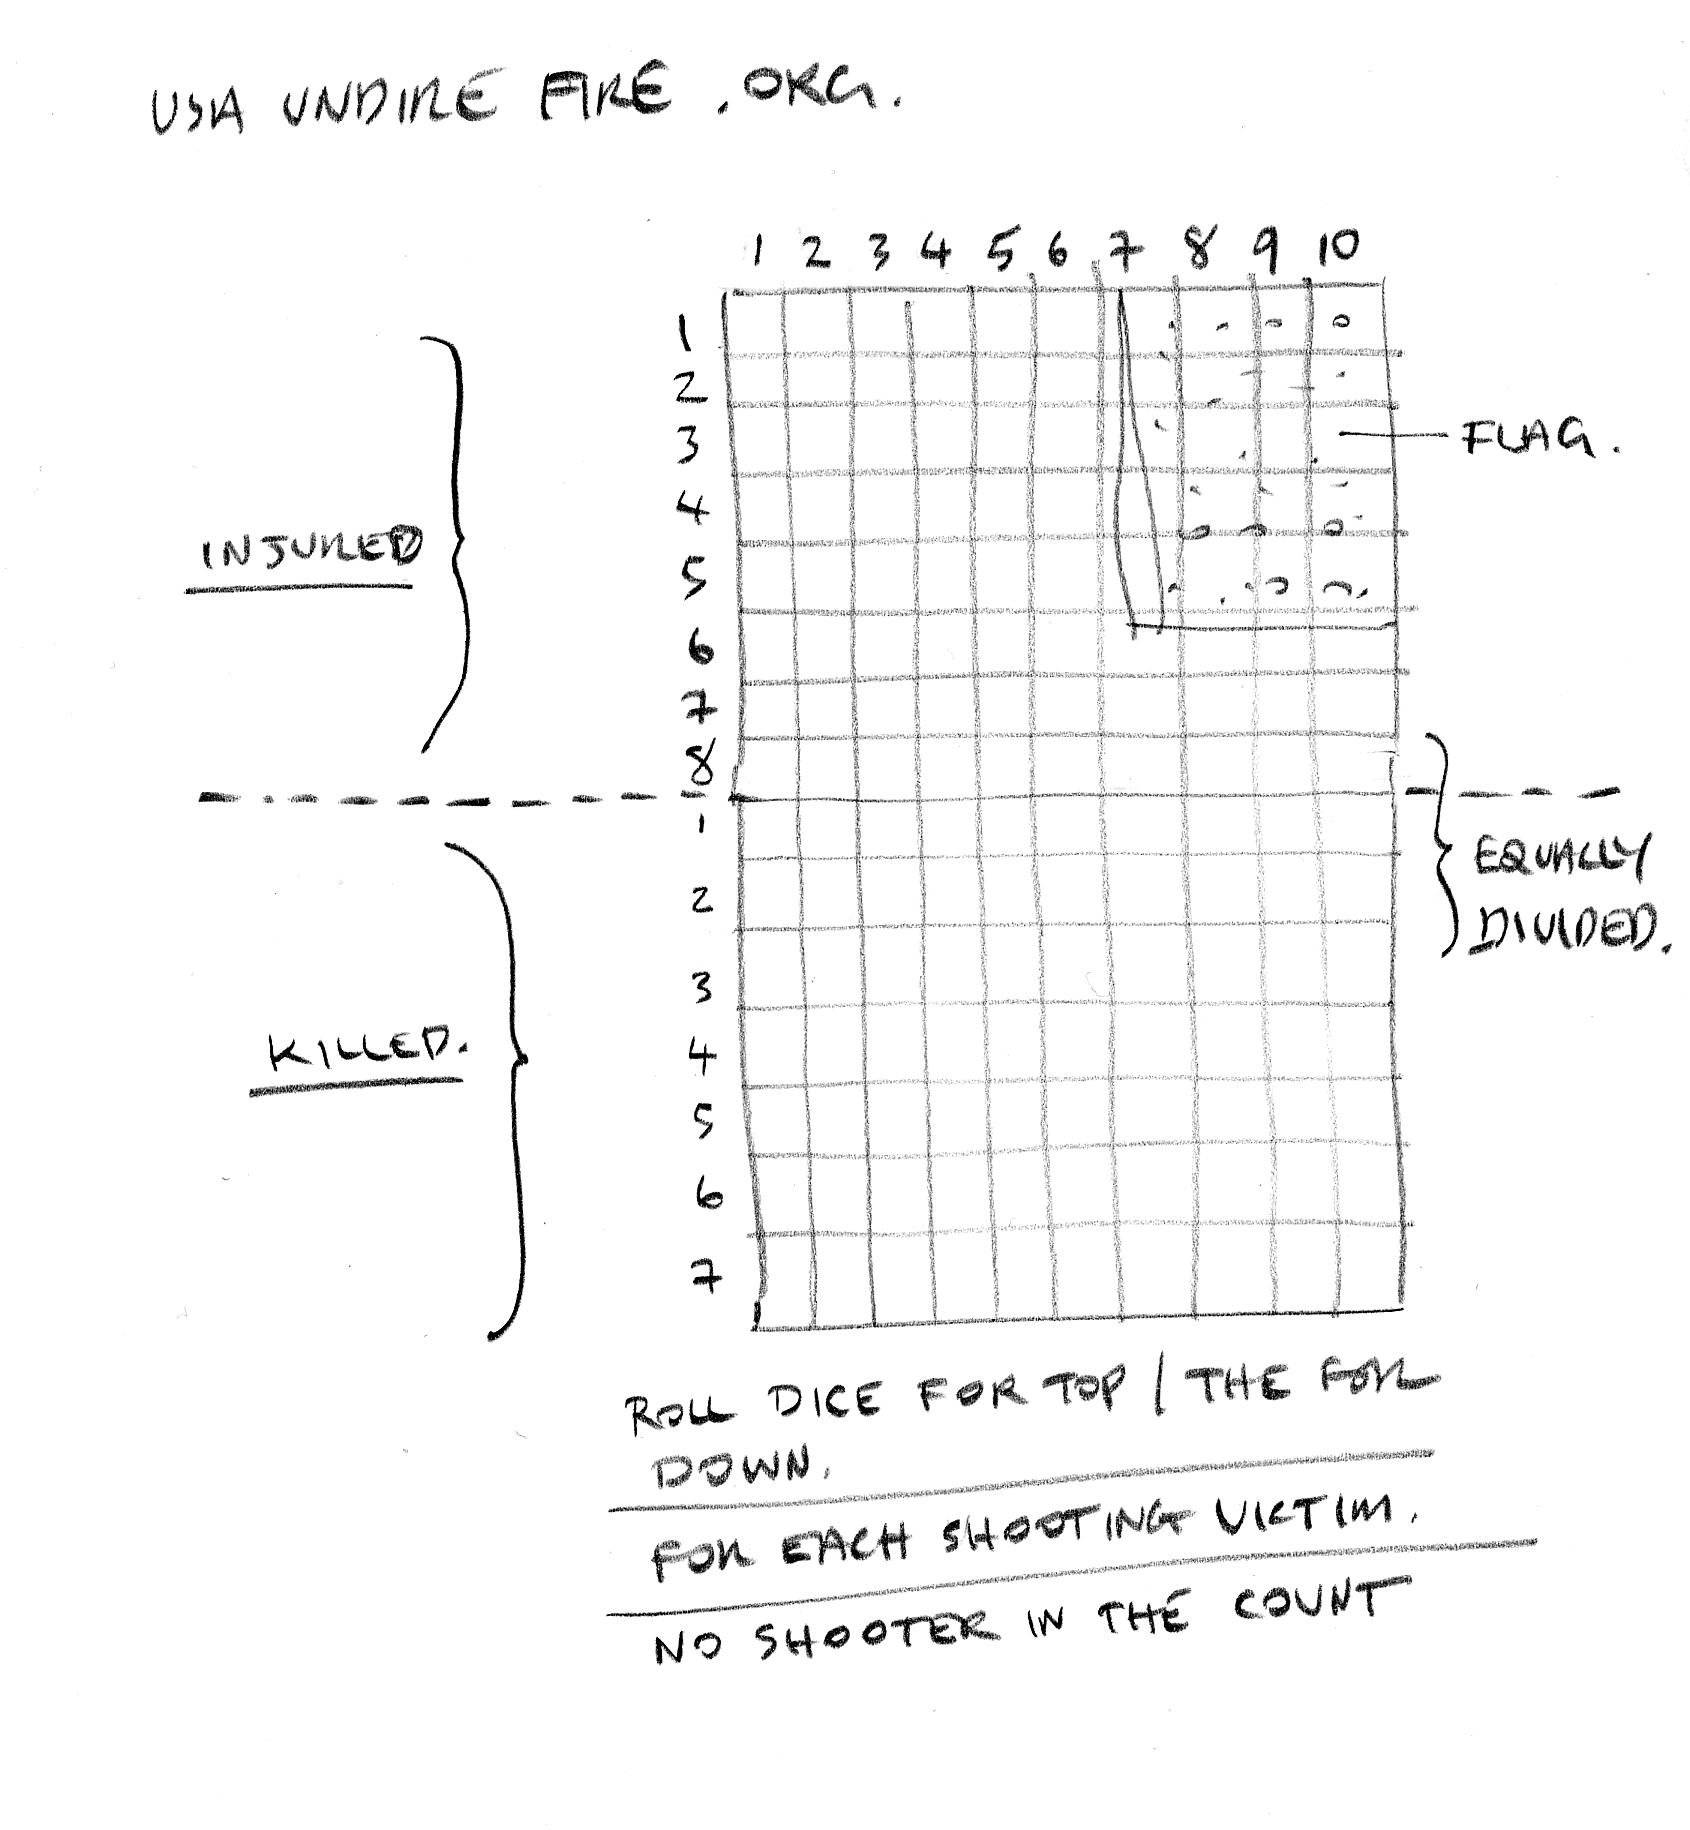
To create each poster, we use the real-time data supplied by The Gun Violence Archive, and then create each individual poster by following the parameters outlined here. Injuries are mapped in the top half of the flag, with deaths mapped out on the bottom half. Each injury, or death, is represented by a bullet hole graphic. Their seemingly random positioning is determined by using this chart. The determination of the placement of the bullet hole is calculated by randomly generated numbers through code, which is then used to place the graphic on the flag. Each poster contains the same flag image, along with the location of the shooting and a timestamp along the bottom which is also driven by the data. One of the goals of this project is to bear witness to the mass shootings in the US for a full year, 2018.